
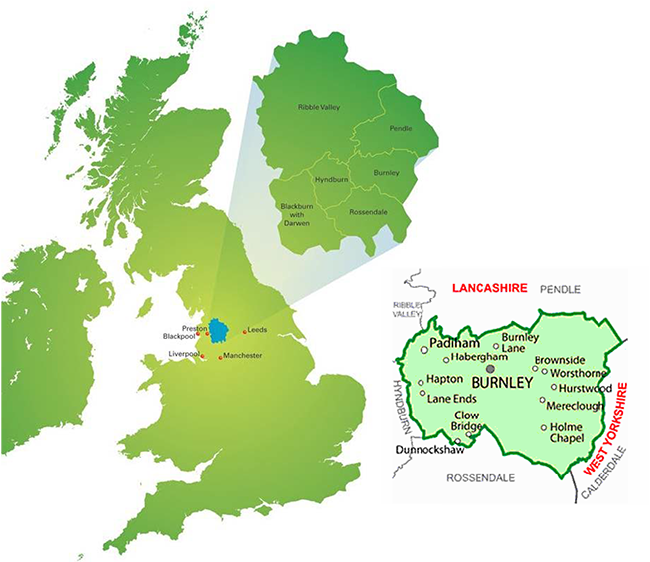
2.1.1 Burnley borough is situated in Pennine Lancashire. It covers an area of 11,072 hectares (42 square miles). Its compact urban area, stretching along the two river valleys of the Brun and Calder, is surrounded by the moorland countryside of the South Pennines to the south and east and the Forest of Bowland AONB and the gritstone outcrop of Pendle Hill to the north. Coal Clough wind farm, which is visible from many parts of Burnley, dominates the skyline to the south east of the town whilst, nearby, the landmark panopticon, the Singing Ringing Tree, overlooks the town from the hills at Crown Point.
2.1.2 There are two main urban settlements, Burnley and Padiham, and a number of small villages and hamlets in the rural area.
2.1.3 Along with Blackburn, Blackpool and Preston, Burnley is one of the key centres in Lancashire. Burnley town centre with its combination of modern shopping facilities and fine civic buildings is an important retail, business and service centre for Pennine Lancashire. Padiham’s town centre is much smaller, reflecting its role as a traditional market town serving a wide rural hinterland. Figure 1: Location of Burnley and Pennine Lancashire
Figure 1: Location of Burnley and Pennine Lancashire
2.1.4 Much of Burnley's character and distinctiveness today derives not only from its attractive Pennine setting, but also from its development during the Industrial Revolution. This gave the inner parts of the urban area their distinctive sandstone terraces in grid-iron street patterns, its mills and fine parks.
Population
2.2.1 The borough’s population at the time of the 2011 Census was 87,059. The most recent ONS 2016 mid-year population estimate (MYE) indicates an increase in Burnley's population to 87,496. Between 1991 and 2011, Burnley’s population fell by 4.5% in stark contrast to a 12.7% rise in England as a whole.
2.2.2 The 2014-based ONS sub-national population projections (SNPP) released in 2016 give a projected population at the end of the proposed new Local Plan period (2032) of 87,303, an increase of 176 people or 0.2% from 2012.
2.2.3 In general, the proportion of older people within the borough population is growing as with the trend in England generally and this is due to a combination of people living longer, lower birth rates and outmigration of younger age groups.
2.2.4 The borough’s population is diverse with about 12.6% of its residents at the 2011 Census being black or minority ethnic, an increase from 8.2% in 2001. There is a continuing pattern of residential separation in Burnley with eight out of fifteen of its wards having 3% or fewer residents who are not white, while two wards have a black or minority ethnic population greater than 25% (Queensgate 29%, Daneshouse with Stoneyholme 82%).2
Deprivation
2.2.5 Within some of the inner urban neighbourhoods there are significant pockets of deprivation. This is in stark contrast to the greater affluence of some suburbs and villages.
2.2.6 In the 2015 Index of Multiple Deprivation (IMD) Burnley was ranked the 9th most deprived area out of 326 local authority areas in England (based on rank of average scores). The most prevalent form of deprivation in the borough relates to health and disability.
2.2.7 Life expectancy for both men and women is lower than the Lancashire and England average3. According to the Burnley Health Profile 2015 (Public Health England), life expectancy is 11.8 years lower for men and 6.0 years lower for women in the most deprived areas of Burnley than in the least deprived areas. Burnley’s rates of mortality from heart disease and stroke, cancer and respiratory disease are all significantly higher than the Regional and England averages (2011-2013 Public Health England, Public Health Outcomes Framework).
2.2.8 Compared to other districts in Lancashire and the country as a whole, Burnley has relatively high levels of crime, the second highest of all Lancashire districts. For 2016 the crime rate was 103.07 per 1,000 population compared to a Lancashire Force average of 70.58 – both figures representing an increase on the previous year.4
| Key Issues & Challenges: |
|
Type
2.3.1 Burnley has a much higher proportion of terraced housing than England or the region as a whole. According to the 2011 Census, 50.1% of Burnley’s housing stock consisted of terraced houses compared to the regional average of 30% and England average of 24.5%. Much of the terraced housing stock comprises pre-1919 two-bedroomed terraced houses and this constrains choice in the housing market.
2.3.2 The previous Pathfinder Housing Market Renewal (HMR) scheme recognised that poor condition, high vacancy rates and a lack of quality and choice of housing, in particular an oversupply of small two-bedroomed Victorian terraced housing without gardens, were key drivers of housing market failure.
2.3.3 Analysis by Council Tax band shows that in 2016, 61% of dwellings in Burnley were in the lowest band 'A' compared to the average for England of 24.5%. The proportion is decreasing gradually. The highest tax bands of 'F' to 'H' accounted for 9.1% of properties in England but just 1.2% in Burnley.
2.3.4 Census data shows that between 2001 and 2011 there had been a significant decrease in the number of Burnley residents in owner occupation and an increase in the percentage in private rented accommodation. These changes most likely reflect the national recession from 2008 and its ongoing after-effects.
Vacancy
2.3.5 At October 2016, there were 2,384 empty homes in the borough, 5.83% of the overall housing stock. This vacancy rate is lower than the previous year and part of a gradual downward trend, but it remains significantly higher than the average for England (2.62%).
Fuel Poverty
2.3.6 The Department of Energy and Climate Change (DECC) defines fuel poverty through the 'low income high costs' method of calculation. A household is defined as ‘fuel poor’ if:
2.3.7 The 2014 results indicate that in Lancashire, 71,075 households (11.3%) were in fuel poverty. Within Lancashire, Pendle (14%) had the 20th worst rate in the country, whilst Burnley at 13.5% had the 27th worse rate (DECC/Lancashire Profile).
The Housing Market
House Prices & Sales
2.3.8 In 2017 average (mean) house prices in Burnley at £103,758 were around 37% of the national average for England and Wales (£292,550) and 55% of the regional average (£188,752), although there is a marked difference between house prices in the rural area and the more urban parts of the borough. In 2016 average overall house prices in the borough rose for the first time above their pre-recession peak level of £97,795 set in June 2008.
2.3.9 Pre-recession dwelling sales in Burnley (2002-2007) totalled over 3,000 transactions per annum (CLG Live Table 588). Since 2007 when the figure stood at 3,121, transactions have more than halved. They have increased significantly in the last few years from 998 in 2013 to 1,549 in 2017 suggesting some recovery in the local housing market (ONS & Land Registry).
Affordability
2.3.10 The now revoked DCLG Practice Guidance for Strategic Housing Market Assessments (March 2007) stated that a household could be considered able to afford to buy a home if it costs 3.5 times the gross household income for a single earner household or 2.9 times the gross household income for dual-income households and that where possible, an allowance should be made for access to capital that could be used towards the cost of home ownership (e.g. a deposit). For those seeking to access mortgage finance, these tend now to be calculated on lifestyle and outgoings rather than on gross income.
2.3.11 The table below shows the ratios of house prices (all types) to income for 2017. These ratios do not include any allowance for a deposit.
2.3.12 Using a median measure, Burnley has the third lowest ratio in England and Wales and for the lower quartile measure, it has the lowest. (The lower the ratio, the more affordable). These contrast to the adjoining district of Ribble Valley with ratios of 1:7.51 and 1: 7.47.
Table 1: House Purchase Affordability Ratios 2017
| Burnley | England & Wales | ||
| Median Income to Median House Price | 2017 | 1 to 3.59 | 1 to 7.91 |
| Lower Quartile Income to Lower Quartile House Price | 2017 | 1 to 3.08 | 1 to 7.26 |
Source: ONS & Land Registry 6 April 2018
2.3.13 Further detailed information on the borough’s housing market is set out in the Burnley Strategic Housing Market Assessment 2016 and in the Authority Monitoring Report (AMR).
| Key Issues & Challenges: |
|---|
|
2.4.1 The Sustainable Community Strategy prepared by the Burnley Action Partnership identifies growing the borough’s economy as the Partnership’s top priority, underpinning all efforts to improve quality of life in the borough. Essential to the whole approach of addressing the socio- economic context is skills development in support of the current and future labour market.
2.4.2 Many parts of Lancashire, including Burnley, still have a high proportion of employment in the manufacturing sector. Burnley now enjoys a strong reputation for advanced manufacturing/engineering, and for aerospace excellence through companies like Aircelle, MB Aerospace and BCW Engineering, producing parts for aircraft and performance cars.
2.4.3 Burnley has a significant concentration of employment activity, including at four large industrial estates: Heasandford, Rossendale Road, Network 65 and Shuttleworth Mead, with new development in more recent years at Burnley Bridge and the aerospace supply village at Innovation Drive. In 2013 the borough was named the most enterprising place in the UK (See https://www.gov.uk/government/news/burnley-named-most-enterprising-place-in-britain).
2.4.4 Projects such as Burnley Bridge, Innovation Drive and On the Banks (Weavers’ Triangle) were supported with loan funding from the Lancashire Local Enterprise Partnership (LEP). The LEP was formed in 2011 to make Lancashire the location for business growth and inward investment and is made up of leaders from business, universities and local councils. The LEP priorities include:
Commuting
2.4.5 At the time of the 2011 Census, Burnley had an inflow of 14,608 people commuting into the borough on a daily basis against 15,272 out-commuters, giving a net total of 664 out-commuters. The borough has high levels of out-commuting to Pendle, Hyndburn and Blackburn with Darwen, whilst Pendle and Hyndburn also have high levels of commuters travelling into Burnley in return. More recent data5 indicates this out-commuting trend continues.
2.4.6 This represented a change from the time of the previous Census, when 13,020 residents commuted out of the borough daily, against 13,085 in-commuters, giving a net total of 65 in-commuters.
Employment
2.4.7 The borough was home to 3,075 enterprises and 38,000 employees jobs in 2016, of which 26,000 were full-time and 12,000 part-time6.
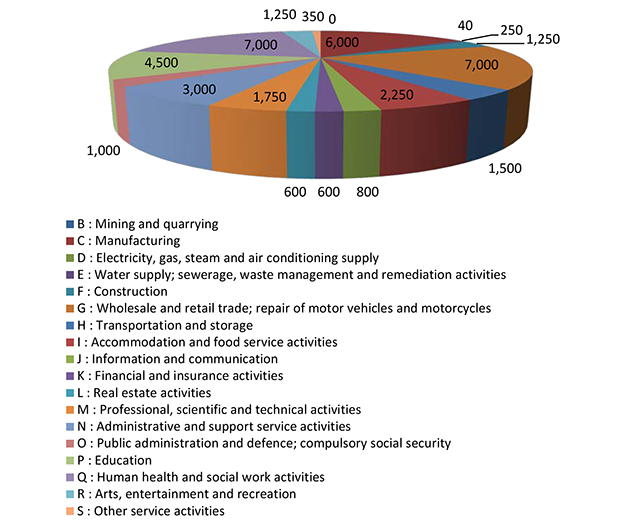
2.4.8 The largest employment sector in Burnley in 2016 was public services (categories o to q) with an estimated 12,500 jobs (32.9.%) a decline from the previous years’ figures but still a higher proportion than the regional and Great Britain averages. Similarly, wholesale and retail (class G) at 18.4%, and manufacturing (class C) at 15.8% also accounted for a higher proportion of workforce jobs than the regional and national average. The proportion of Financial and other business services jobs (classes K to N) at 15.7% was significantly lower than the regional and Great Britain averages of 21.6% and 22.8% respectively.7
2.4.9 The split of jobs types in Burnley in 2016 can be seen in
Figure 2. Figure 2: Burnley’s job types
Workforce and Earnings
2.4.10 The economically active population includes all those who are in employment and those unemployed but seeking work.
2.4.11 In 2016 (Jan to Dec) Burnley had an estimated 45,600 economically active residents with an economic activity rate of 80.4%, which is greater than the regional (75.6%) and Great Britain rate (77.8%), the rates having risen above the regional and national rates in late 2015, reflecting the recent jobs growth figures reported by Experian (2,600 jobs 2012-2016).8 9
2.4.12 Historically claimant count unemployment levels in Burnley have been above the regional and national rates. Levels of JSA claimants rose significantly in Burnley between 2008 and 2009 (as they did across the region and Great Britain as a whole, reflecting the onset of the recession, although they rose more significantly in Burnley), with levels peaking at 5.3% in February 2012. Due to the gradual move to Universal Credit, which includes a wider range of claimants than job seekers allowance, comparison is difficult.
2.4.13 In 2016 full-time resident wages in Burnley at £474.1 per week (£24,170 per annum) were significantly lower than across the North West (£501.2 or £26,178 per annum) and Great Britain (£541.0 or £28,314 per annum) as a whole. Workplace earnings are also significantly lower than the North West and Great Britain averages (£440.5, £503.2 and £540.2 respectively). Those who live in the borough earn more on average than those who work in the borough (and may live in the borough or elsewhere). These figures, together with the overall net out-commuting pattern shown in the 2011 Census, suggest that borough residents are seeking higher paid work outside the borough.10
2.4.14 A fuller analysis of the borough’s economy and employment sites and land demand is set out in the Burnley Employment Land Demand Study of June 2016 and the Authority Monitoring Report.
| Key Issues & Challenges: |
|---|
|
Town Centres
2.5.1 Burnley town centre is the dominant retail and leisure destination in the borough. The main shopping area is centred on St James’s Street and the Charter Walk Shopping Centre which has been partly refurbished, with further works planned. The night time economy is focused on Hammerton Street and neighbouring streets. Burnley town centre is reasonably compact, being largely contained within an inner ring road. However, there are retail parks, superstores and leisure facilities outside the inner ring, including a cinema and bowling alley.
2.5.2 Although a large part of its central shopping area dates from the 1960s, Burnley town centre does retain much of its Victorian character of attractive buildings and streets built around a number of waterways, including the Rivers Calder and Brun and the Leeds & Liverpool Canal. The ‘Straight Mile’ stretch of the Canal is a distinctive landmark.
2.5.3 In 2013, Burnley town centre contained a lower than average proportion of Use Class A3/A5 (food and drink establishments). The proportion of Use Class A1 retail units had decreased by 15% between 2000 and 2012, whilst the number of vacant units increased. The Burnley Retail, Office and Leisure Assessment 2013 prepared by Nathaniel Lichfield and Partners considers that Burnley town centre could reasonably accommodate additional Use Class A3/A5 units without prejudicing the retail function of the centre. Since 2013, the number of Use Class A3/A5 units has increased.
2.5.4 Padiham town centre performs a supporting role to Burnley in terms of the retail hierarchy. It is linear in nature and divided by the busy A671. A Tesco store is located to the east of the A671.
Visitor Economy
2.5.5 As well as its attractive countryside with walking routes, cycle paths and bridleways, visitors are drawn to the area by the historic houses of Towneley Hall and Gawthorpe Hall. The borough's industrial heritage also plays an important role in the visitor economy, notably the Weavers' Triangle - one of the finest examples of a Victorian industrial landscape in the North West.
2.5.6 Burnley Football Club and the Woodland Spa attract significant numbers of visitors to the town. The Pennine Way is located to the east of the borough. Part of the Pennine Bridleway National Trail, the Bronte Way and the Burnley Way, offer riders, walkers and cyclists clearly signed routes through the countryside immediately surrounding the town. The Leeds & Liverpool Canal is also a key tourist asset and its towpath forms part of the National Cycle Network.
2.5.7 Based on figures for Burnley's main attractions, overall visitor numbers stood at 2.5 million equating to 4% of all tourism visits to Lancashire in 2016. A total of £109.4 million was generated within the local economy through visitor and tourism business expenditure. Full time equivalent jobs supported in the visitor economy stood at 1,408 - around 2% of the total jobs.
2.5.8 In relation to its size, the borough does not have the amount or range of accommodation that might be anticipated. Total bedstock in Burnley is 801 beds comprising 73 non-serviced and 728 serviced beds.11
2.5.9 In terms of hotel accommodation, there are good quality hotels in the borough but there are none above 3-star rating and no hotels able to deal with coach parties of 50+ people on a regular basis.
| Key Issues & Challenges: |
|---|
|
The Historic Environment
2.6.1 Burnley’s built and historic environment is a major strength which contributes significantly to the quality of life that underpins the borough’s economy and attracts investment. The borough has a rich and varied collection of heritage assets of local, regional and national importance which are not only important for their own sake, but are central to the character and identity of the borough, acting as a stimulus and inspiration to contemporary architecture and regeneration initiatives.
2.6.2 Burnley’s built heritage serves as a unique and irreplaceable record of Burnley’s development over time. It is the rapid and concentrated development of Burnley during the Industrial Revolution that contributes most significantly and positively to the character of the built urban environment. However, there is a long history of human settlement in the borough with evidence of human activity to the eastern moorland fringes dating back to the Bronze Age. The oldest surviving buildings originate from the 1500s and include Towneley Hall, St Peter’s Church and Spenser House (Hurstwood). The rural parts of the borough are characterised by vernacular buildings (built from locally available materials that reflect custom and tradition rather than the architectural fashions of the time) and include a significant number of farmhouses, cottages and barns of 17th Century origins. The evolution of the borough continues to be relevant to people living within and outside the area and its history and heritage act to shape people’s lives and the landscape around them.
2.6.3 It is widely accepted that the borough’s heritage assets make a positive contribution to the environment, the quality of life of the local community, and economic regeneration of the area. Indeed, significant steps have already been taken by the Council to ensure the preservation of the architectural and historic environment of the borough through direct involvement in projects such as the restoration of Victoria Mill (UTC), Weavers’ Triangle Townscape Heritage Initiative and Towneley Park Restoration Project. These initiatives have been strongly supported by Historic England and the Heritage Lottery Fund.
2.6.4 The key elements that make a significant contribution to the local character and distinctiveness include:
Heritage Assets
2.6.5 There are 306 listed building entries in the borough. Of these, five are Grade I, 14 Grade II* and 287 Grade II. Each entry can include a number of buildings and structures; for example, one listing entry can comprise a row of terraced housing.
2.6.6 The Council also has a non-statutory local list of buildings with more than 400 entries.
2.6.7 There are 10 Conservation Areas and 22 Scheduled Monuments (see list at Appendix 4).
2.6.8 There are five Registered Historic Parks and Gardens in Burnley; Towneley Park, Thompson Park, Scott Park, Queen’s Park and the gardens associated with Gawthorpe Hall, all of which are open to the public, forming a significant resource for local residents and visitors.
2.6.9 Whilst many of Burnley's heritage assets are in use and well maintained, problems occur when buildings fall out of use and/or are not easily adaptable to alternative uses, thus falling into a state of neglect and disrepair. Heritage at risk of being lost through vacancy, neglect or decay is a significant issue in the borough. Vacant and poorly maintained heritage assets are more likely to fall into disrepair and this can ultimately lead to the partial, or complete, loss of the asset itself and the character of the area of which they are irreplaceable components. The poor management and maintenance of heritage assets can detract from their ability to meet their intended function, as well as significantly detract from the environmental quality and attractiveness of the borough. This can have a wider range of impacts, such as acting as a disincentive to investment in the area, increasing crime and the fear of crime and creating a poor image of a neighbourhood. Securing appropriate, viable and continued use of Burnley's heritage assets should therefore be an important priority as this will help manage those heritage assets already at risk and prevent further assets falling into disrepair.
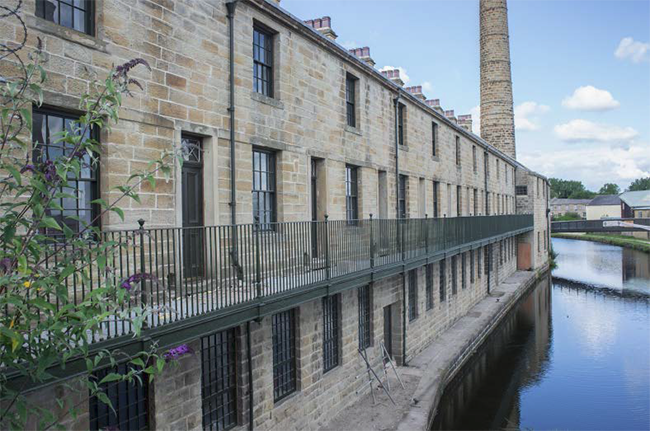
Slater’s Terrace in the Weavers’ Triangle – part of the ‘On the Banks’ development on the Leeds & Liverpool Canal which forms part of the Canalside Conservation Area
Design and Public Realm
2.6.10 There is a tradition of innovative and high quality design approaches to development in Burnley, many of which have proven to be of exceptional quality and significance. Buildings such as Burnley Bus Station, Unity College, Burnley Youth Theatre, Job Centre Plus and Burnley College, and residential developments including Hirst Gardens (Burnley Wood) and Pennine View (South West Burnley) demonstrate how high quality architecture and good urban design can enrich the environment. These schemes serve as benchmarks for design quality and demonstrate a commitment to contextual, sustainable and innovative design.
2.6.11 Good design that draws on the existing strengths of the borough's unique heritage and creates a sense of place is essential in creating attractive, safe and prosperous places. As with many places there are examples of modern design and public realm treatment that have failed to positively contribute to the character of the area or to local distinctiveness, resulting in standard, ‘anywhere’ developments.
2.6.12 Public art installations such as the Singing Ringing Tree at Crown Point and Rainbow Gate on Princess Way enrich the public realm and reinforce the borough’s identity.
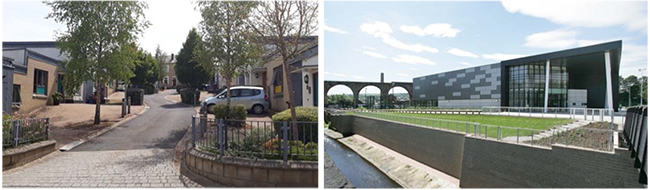
Photos - Hirst Gardens, Burnley Wood and Burnley College
| Key Issues & Challenges: |
|---|
|
Landscape
2.7.1 An estimated 80% of the borough is rural and the urban area characteristically has open views of the surrounding countryside, including the Pennines and the distinctive landmark of Pendle Hill.
2.7.2 The borough's open landscapes are one of its greatest assets. They provide a visually striking setting for the urban area, a recreational resource and a ‘green lung’ in close proximity to the built-up area. Burnley's distinct landscape character types each face their own set of challenges, including pressure from development, recreational activities and climate change. Agriculture and forestry activities can present challenges, but these industries also play a valuable role in protecting the landscape as we value it today.
2.7.3 The borough falls across two National Character Areas (NCAs); No. 35 Lancashire Valleys (2013) and No. 36 Southern Pennines (2012).12
2.7.4 The close interrelationship between urban and rural areas is a key part of Burnley’s character and the accessibility of the borough’s urban areas to open countryside and high quality landscapes, such as the South Pennine Moors, is crucial in terms of promoting the borough as a place to live, work and visit. The rural area is a significant resource for walkers, cyclists and horse riders.
2.7.5 Most of the rural area to the north and west of the borough is designated as Green Belt which contains the built-up area and prevents coalescence with the urban areas of Pendle and Hyndburn.
Open Space and Green Infrastructure
2.7.6 Burnley's green infrastructure (GI) is the network of green spaces, both urban and rural, natural elements and pathways that intersperse towns and villages. As a network it includes parks, open spaces, playing fields, woodlands, but also street trees, allotments and private gardens. It also includes Burnley’s rivers and streams, the Leeds & Liverpool Canal and other water bodies (blue infrastructure).
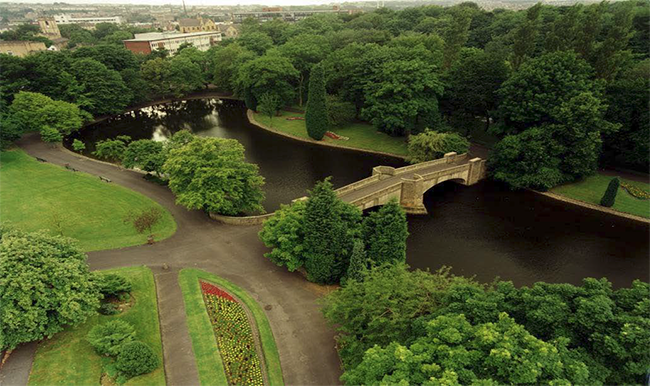
Photo - Burnley's Parks
2.7.7 GI makes a vital contribution to health and well-being. Burnley’s GI is recognised as a significant asset, providing a range of functions that support broader economic, social and environmental objectives.
2.7.8 The borough has a range of high quality and accessible parks and open spaces that effectively bring the countryside into the urban area, but this masks the situation in some of the borough’s urban neighbourhoods where open space provision falls short of standards set in the Council’s Green Spaces Strategy 2015-2025. The Strategy includes an audit of all types of green space in terms of quality, quantity and accessibility.
2.7.9 A growing network of high quality off-road routes or greenways promote walking and cycling within the urban area and provide people with access to the open countryside close to where they live. This network includes the Leeds & Liverpool Canal towpath and greenways established along the banks of the Calder, Brun and Sweet Clough rivers and the former Padiham railway line.
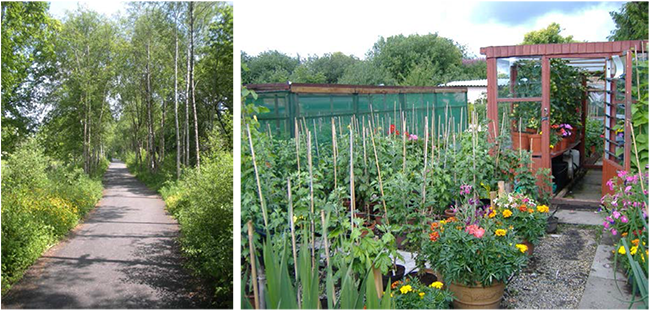
Photos – Left Padiham Greenway and right Allotments
2.7.10 Many of Burnley’s urban neighbourhoods are lacking in recreational open space and play provision according to the local standards set out in the Council’s Green Spaces Strategy 2015-2015.
Biodiversity
2.7.11 The borough has one nature conservation site of international significance, the South Pennine Moors which is a Special Protection Area (SPA), Special Area of Conservation (SAC) and Site of Special Scientific Interest (SSSI). The Moors are protected under European and national legislation both for their mosaic of habitats and the range of species and number of breeding birds they support.
County Biological and Geodiversity Sites
2.7.12 Burnley has 43 Local Wildlife Sites, known in Lancashire as Biological Heritage Sites (BHS). These are the most important non-statutory wildlife sites in Lancashire and cover a wide variety of habitats such as ancient woodland, grassland, and wetlands. Burnley also has five Local Geodiversity Sites (LGS) identified by GeoLancashire as the most important places for geology and geomorphology outside statutorily protected sites such as SSSIs. They are important as an educational, historical and recreational resource.
Ecological networks
2.7.13 A coherent, well connected network of habitats is essential to maintain biodiversity and enable species to adapt to a changing climate. Lancashire County Council has identified three key ecological networks across Lancashire; grassland, woodland and heath/wetland13, collectively known as the Lancashire Ecological Network. To date, specific networks have been identified and mapped for grassland and woodland habitats.
Local Nature Reserves
2.7.14 Local Nature Reserves (LNR) are a statutory designation made under Section 21 of the National Parks and Access to the Countryside Act 1949. LNRs are for both people and wildlife and offer convenient access to nature and special opportunities to study or learn about nature or simply to enjoy it. All district and county councils have powers to acquire, declare and manage LNRs. To qualify for LNR status, a site must be of importance for wildlife, geology, education or public enjoyment.
2.7.15 There are two LNRs in Burnley; the Deer Pond in Towneley Park and Lowerhouse Lodges. Both are also Biological Heritage Sites.
2.7.16 Natural England recommends 1 hectare of LNR per 1000 population. The land area of LNRs in Burnley totals 11.47 hectares, far short of the 87 hectares recommended for Burnley's population.
Rivers and Flood Risk
2.7.17 There are almost 50km of watercourses within the borough. Water quality has improved significantly in recent years and work undertaken to improve Burnley’s heavily modified urban rivers has seen major improvements for wildlife and recreation.
2.7.18 The Calder and its tributaries (particularly the Brun in Burnley and Pendle Water and Green Brook in Padiham) are the main source of fluvial flood risk in the borough. The urban areas most at risk of fluvial flooding are Padiham town centre where serious flooding occurred in December 2015, Burnley town centre and the adjacent Burnley Wood/Fulledge neighbourhood all of which include significant areas at high risk of flooding (i.e. within Flood Zone 3). Risk of flooding from sources other than rivers including surface water, groundwater and sewer flooding is increasing due to the quantity and intensity of rainfall. Lancashire County Council is the Lead Local Flood Authority responsible for managing this local flood risk and for advising the Borough Council on drainage matters in new development.
Climate Change & Pollution
2.7.19 Burnley, like all other districts in Lancashire, has seen emissions of carbon dioxide fall between 2005 and 2013. The domestic sector makes the greatest contribution to Burnley's total emissions. Burnley’s total per capita output of carbon emissions (5.4 tonnes, DECC 2013) is among the lowest of Lancashire authorities. Renewable energy generation has a key role in reducing pollution, and the location and design of buildings and green infrastructure all have an important role to play both in reducing pollution and mitigating and adapting to climate challenge.
2.7.20 Implementing measures to reduce air pollution at a local level is extremely important, including air quality limits for nitrogen dioxide. Although there are no formal Air Quality Management Areas (AQMAs), there are several areas of the borough where traffic emissions are impacting on air quality.
2.7.21 The borough has a number of sites contaminated by past industrial uses and tipping. Development can provide an opportunity to remediate and bring such sites back into use, or these can be restored as open space.
| Key Issues & Challenges: |
|---|
|
Transport
2.8.1 Transport and economic growth are interlinked. The 18th Century saw the rapid growth of Burnley with the opening of the Leeds & Liverpool Canal in 1801 making possible the transportation of goods in bulk. In 1848, the East Lancashire Railway Company's extension from Accrington linked the borough to the nation's nascent railway system for the first time. This was another significant boost to the local economy. In the 20th Century, the completion of the M65 motorway in 1997 attracted the development of new employment areas, such as Network 65 and Shuttleworth Mead.
2.8.2 Burnley is served by Junctions 9, 10 and 11 of the M65, which runs west to Accrington, Blackburn and Preston where it connects to the M6, and north east to Nelson and Colne. The A56 (T) dual carriageway skirts the western edge of the borough, linking the M65 at Junction 8 to the M66 heading south towards Manchester, the M60 and M62.
2.8.3 Although Burnley is relatively close to Manchester, which offers a wide variety of services and employment opportunities, inadequate public transport links restricted the ability of Burnley residents to access them. This reduced the attractiveness of Burnley as a place to live. The introduction of a direct rail service to Manchester in 2015 has improved connectivity and, although this is initially only an hourly service, it is important that the Local Plan maximises the opportunities that this presents.
2.8.4 Road links to larger centres like Manchester, Preston and Leeds are good, but capacity is constrained. The M65 Corridor Study (2010) commissioned by the Highways Agency suggests that the inconsistent configuration of lanes could potentially lead to congestion and that between junctions 9 -10 eastbound the motorway will be approaching capacity in the morning and evening peak periods throughout the assessment period up to 2025. In addition, on junction 10, there were a high number of incidents involving rear end shunts. The section of motorway between junctions 11-12 had one of the highest frequencies of incidents where driver error was the most common cause.
2.8.5 Within Burnley, only one of the three junctions has both east and westbound exits, placing additional demands on local roads. The connection to Manchester is via the M65 (T)/M66 which is congested at peak times and is identified by the Highways Agency as a key pressure point. Road connections east to the Leeds City Region are poor.
2.8.6 There are five railway stations in the borough: Burnley Manchester Road, Burnley Central, Burnley Barracks, Rosegrove and Hapton. Manchester Road is the busiest station with an hourly service west to Preston and Blackpool North and east to Leeds and York. An hourly service to Manchester Victoria runs from a redeveloped Manchester Road station and Rosegrove station. Burnley Central and the three other stations in the borough are served by an hourly stopping service west to Blackpool South and Preston, and east to Nelson and Colne.
2.8.7 According to the 2011 Census, 32% of the borough’s households do not own a car, the highest rate in Lancashire and compared to the Lancashire average of 23%. However, travel by car is still the predominant mode of transport to get to work (39%). Only 0.4% of people travel to work by train and only 5.1% by bus. 7.3% travel to work on foot and 0.6% by bicycle.
2.8.8 Burnley is notable for the high proportion of work trips of less than 5km (47%). 21% of these journeys are made on foot and 1.6% by bicycle. There is potential to increase the number of these journeys made by cycling and walking by providing safe and convenient routes.
2.8.9 Burnley has low but increasing cycle use. In 2013/14, Burnley had a rate of 5.8% of residents who cycle at least once a month, irrespective of length or purpose. This was the second lowest rate in the country. Traffic on main roads is one factor which acts as a barrier to cycle use and, a particular problem for cyclists is the Burnley town centre inner ring road. The Canal towpath has been upgraded over a number of years to offer an alternative cycle route. However, access to the town centre from the Canal is poor.
2.8.10 Bus provision is good with regular services to nearby towns and around the borough. These operate through Burnley bus station which was opened in 2002 and is centrally located in the town. In addition to the good services connecting residential areas to both Burnley and Padiham town centres, there are frequent services to Manchester via the X43 route and services between Padiham and Barnoldswick (via Burnley), Clitheroe and Colne (via Padiham and Burnley), Accrington and Trawden (via Hapton, Padiham and Burnley) and Burnley and Keighley.
Education
2.8.11 Burnley has the benefit of reorganised and renewed secondary school provision that was completed in three phases between 2008 and 2010 under the Building Schools for the Future Programme.
2.8.12 The former further education Burnley College facilities closed and a combined further education college and University at Princess Way opened in September 2009. This new campus complex, in conjunction with University of Central Lancashire (UCLAN), offers over 70 degree programmes from foundation level to postgraduate entry, as well as more than 40 A-Level courses and a range of vocational subjects and apprenticeship schemes.
2.8.13 The percentage of Burnley pupils attaining 5 A*-C GCSEs, including English and Maths was 47.2% in 2014.15 which represents an 11.2% increase since the start of the Building Schools for the Future (BSF) programme in 2008/9.
2.8.14 However, skills and educational attainment still remain a challenge. The percentage of adults qualified to NVQ Level 4 and above (HND, Degree and Higher Degree level qualifications or equivalent) was 25.7% for the 2016 calendar year, significantly below the national average14, and there is a mismatch between skill levels in the borough and growth sectors within the economy.
Sport and Leisure Facilities
2.8.15 The image of sport in the borough is dominated by Burnley Football Club and for a town of its size Burnley has good public sporting facilities.
2.8.16 In terms of sports and leisure facilities, the St Peter’s Centre in Burnley, Padiham Leisure Centre and the Prairie Sports Village at Windermere Avenue to the north of Burnley are managed by Burnley Leisure Trust.
2.8.17 The St Peter's Centre in Burnley town centre offers swimming, short tennis, squash courts and a fitness suite. The Prairie Sports Village offers a 16-bay golf driving range and an FA approved 3G floodlit football pitch. The nearby Spirit of Sport complex at Blessed Trinity RC College has an indoor sports hall, astroturf, dance studio and netball courts. Ten public outdoor bowls facilities are available within the borough and one indoor ten-pin bowling centre.
2.8.18 There is an outdoor athletics track at Barden Lane in the north of the borough and both a 9- hole and 18-hole municipal golf course and tennis courts at Towneley Park. There is a skate park at Queen's Park. There are private sport and recreation facilities at Crow Wood including a swimming pool, tennis and squash courts and at Burnley Golf Club. 25 village halls and community centres provide opportunities for participating in events, activities and fitness classes.
2.8.19 Fishing occurs on the Rivers Calder and Brun, Cant Clough Reservoir, Lowerhouses Lodges, Cornfield Fishery, Swinden Reservoir and at Cliviger fish ponds. Rowley Lake, the pond adjacent to Netherwood Road and the Leeds & Liverpool Canal are also regularly used by anglers.
2.8.20 The Council’s Playing Pitch Strategy 2016-2026 produced jointly with Pendle and Rossendale councils indicates there is an identified future demand shortfall in the provision of pitches for adult and youth football.
2.8.21 Sport England conducted an Active People survey15 during 2012/13 and this suggested that 70.1% of Burnley residents do not participate in sport at least once a week (compared to 64.2% in the North West and 64.3% in England). This has increased by 5.4% from 2011/12. According to the survey, 34.9% of men and 25.1% of women participate in sport at least once a week. These figures are 7.4% below the North West average for men and 4.5% below the North West average for women.
Other Infrastructure
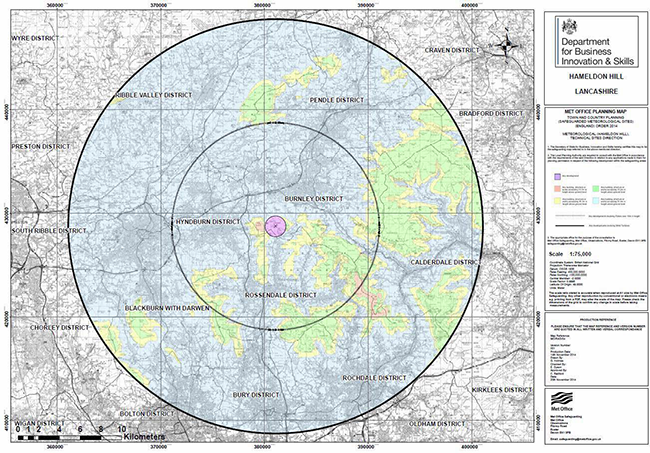
2.8.22 The Met Office’s radar at Hameldon Hill provides important observation information which is essential for producing weather warnings and forecasts for a large number of customers including Local Authorities, MOD, the Environment Agency, airports, emergency services and other maintainers of essential infrastructure. In recognition of this, a Government Direction was issued in 2014 to require consultation with the Secretary of State for Business Innovation and Skills (BIS) acting through the Met Office on planning proposals within consultation zones around the installation.
2.8.23 The safeguarded consultation zone identified by BIS covers an area up to 20km in radius from the installation as shown on the map below.
Figure 3: Hameldon Hill Safeguarded Consultation Zone
| Key Issues & Challenges: |
|---|
|
2 Source: 2011 Census table KS210EW
3 Office for National Statistics, Life Expectancy at Birth and at Age 65 by Local Areas in England and Wales, 2012-14
4 Excluding Fraud. Source Home Office and ONS 2015 MYE population
5 Annual Population Survey and Experian Jobs Growth - See 2017 SHMA Addendum para 3.2 - 7
6 Interdepartmental Business Register and ONS Business Register and Employment Survey. The employees figures do not include the self-employed, farm based agriculture Gov supported trainees and HM Forces
7 ONS Business Register and Employment Survey: open access
8 ONS Annual Population Survey (2016)
9 See 2017 SHMA Addendum
10 ONS Annual Survey of Hours and Earnings
11 2016 STEAM figures from Visit Lancashire / Global Tourism Solutions (UK) Ltd
12 NCAs are compiled by Natural England, full details can be viewed at http://publications.naturalengland.org.uk/publication/12237027
13 Lancashire Ecological Network and Framework report 2013
14 Source ONS Annual Population Survey - % is a proportion of resident population of area aged 16-64.
15 Source: Sport England Local Sport Profile, 2014
< Previous | ^ Top | Next >