Help
In order to use this interactive version of the Three Rivers District Council
Local Plan to its fullest potential it is strongly recommended
that the user reads this guide before proceeding.
Contents
Introduction
The maps can be accessed by clicking on the Maps link on the
header bar.
The main site consists of a map, and on the right slide out content with the the following tabs.
This is opened and closed by clicking this button. 
Map Location Searching
Overview Map
Map Layers
Map Policies
^ Return to Contents
Navigating around the map
The mapping comprises 8 levels of zoom ranging from OS 1:250,000 to detailed OS MasterMap data.
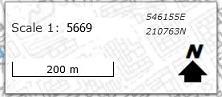
The current map viewing scale and scale bar are displayed towards the bottom left of the map.
In order to pan around the mapping -
- Select the Pan tool
 to be able to pan the map by clicking and dragging the map.
- Press the up/down/left/right arrow keys on the keyboard to pan the map
in this direction.
In order to zoom in and out of the mapping -
- Click on the Zoom in
 or Zoom out
  icons.
- Double click on the map to zoom in at the clicked point.
- Select the Zoom tool
 and drag a zoom extent over the map.
- Key in a desired map scale
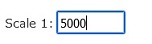 and press enter.
- Press the +/- keys to zoom in/out
Use the Zoom Previous tool  or the Zoom Next tool
  in order to go to the previous and next zoom extent in your zoom history.
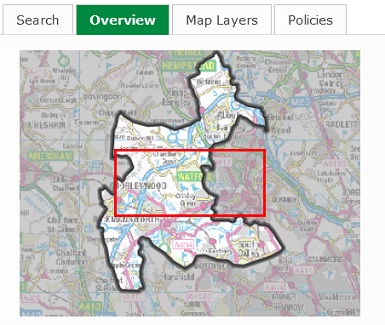
Overview Map
Use this control to quickly navigate to a specific part of the region.
Note, the red square indicates the current map view
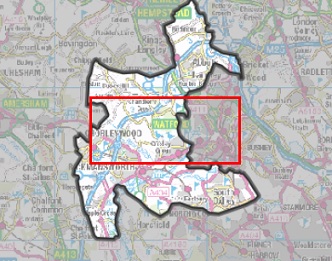
Click on this image to navigate to this part of the region, or drag
the coverage indicator box to the desired part of the region
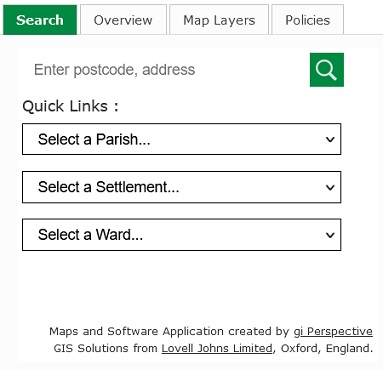
Location Searching
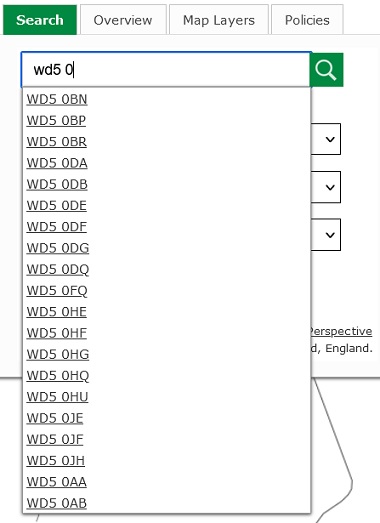
Use this to navigate the mapping to a specified postcode, address or locality within the region
- Enter the postcode, address or locality name, or part of in the box.
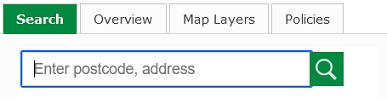
(Please enter as much as you know to ensure you can navigate to the
desired location)
- The search will return the list of matches as you type, from which the user can click on to zoom the map to this location.
An example is shown below.
- To navigate to a specific locality in the region use the quick
links. This contains a list of major localities in the region in
which the user can quickly navigate to.
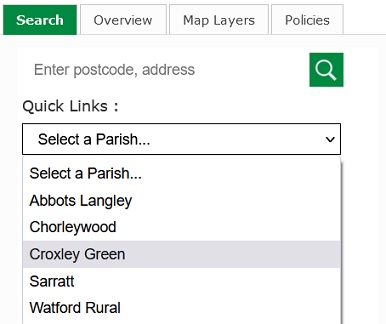
- The map will zoom to the locality and mark the location with a marker. Click the Delete Marker option in the feature popup to remove the marker from the map.
^ Return to Contents
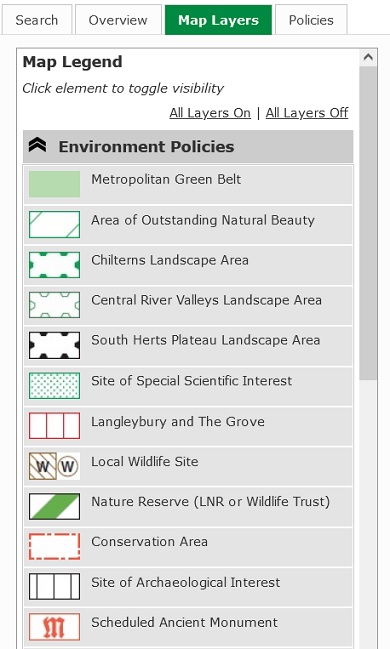
Map Layers
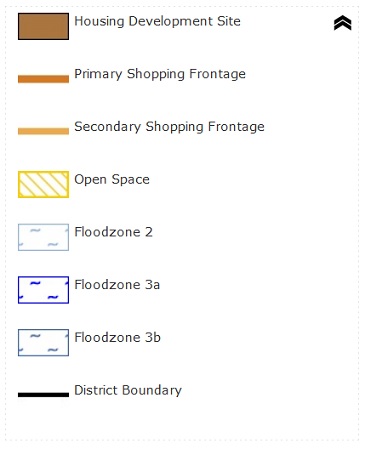
The map layers list provides functionality to control what policies are
visible over the base mapping. Visible layers will be highlighted in grey. By default all layers will be visible on intialization of the map
Each individual layer item also doubles as a key to indicate how this policy layer is displayed on the map.
- To turn all layers on click on the All Layers On link.
- To turn all layers off click on the All Layers Off link.
- To turn an individual layer on/off click on the layer entry in the list.
- To turn a group of layers on/off click on the layer group heading.
- To collapse a layer group click on the
 symbol and to expand the
  symbol.
Clicking the symbol while holding down the shift key will expand/collapse
all layer groups.
symbol.
Clicking the symbol while holding down the shift key will expand/collapse
all layer groups.
Please note that the interactive map allows policy boundary information
to be displayed above the native scale at which they are shown on the
source mapping.
^ Return to Contents
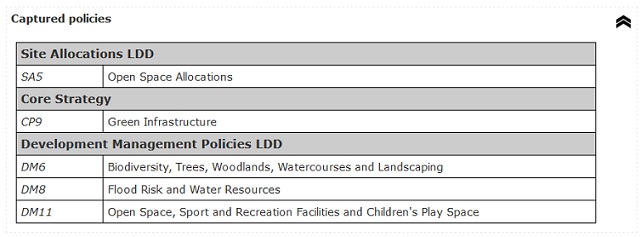
Querying the policy data
The site is able to query the map and return a list of policies associated
with that query, as shown below.
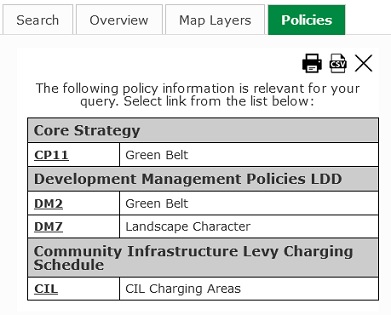
By clicking on each individual policy link, the user is able to view
text information from the Written Statement pertaining to this policy.
Note, that only the policies that are visible on the map will be used in the queries. So for a comprehensive query please ensure all the policy layers are visible.
Click on the Print button  to open the list of captured policies in a new window ready for printing.
Click on the Export button  to save the list of captured policies as a CSV file.
Click on the Close button  to clear the list of captured policies.
Use the Next > and < Previous links to scroll through the full list of captured policies if appropriate.
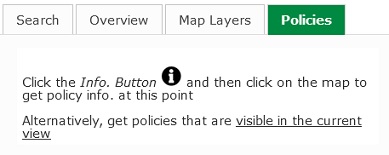
The map data can be queried by any of the following methods -
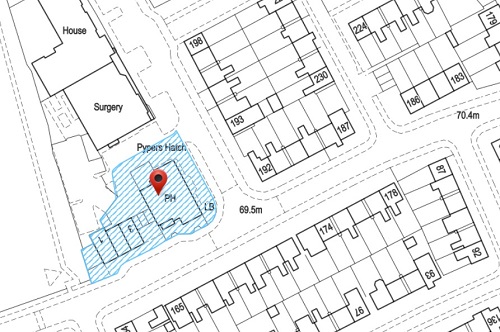
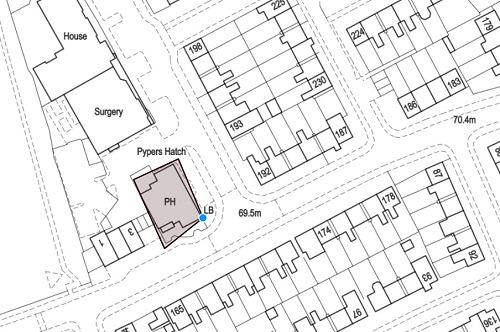
By point location
- Select the info button on the toolbar

- Click on the map and a list of all policies associated with this
point location will be displayed under the Policy Info. tab on
the right.
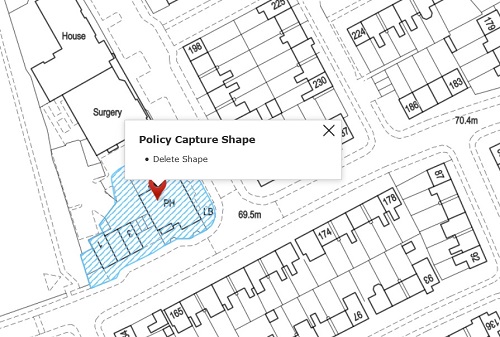
- The capture point will be indicated by a marker.
- To delete click on the marker and choose the Delete Shape link.
By polygon shape
- Select the capture by shape button on the toolbar

- Draw the shape over the map -
- To draw a polygon click on the map to define each shape
vertex. To complete drawing double click. Press the Esc key to cancel the drawing.
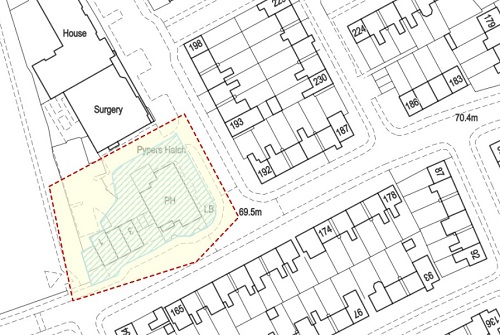
- After the shape has been drawn, a list of all policies associated with this
shape will be displayed under the Policy Info. tab on
the right.
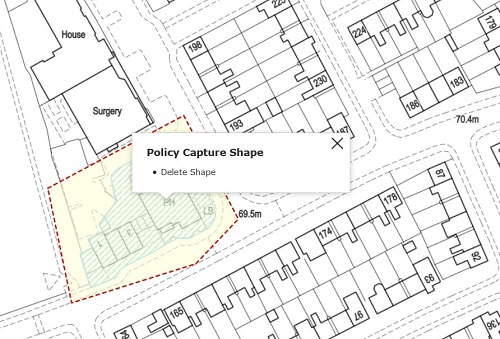
- To delete, click on the shape and choose the Delete Shape link.
By map view
- Click on the "visible in the current view" link as shown
below to list all the policies that are visible in the current map
view.
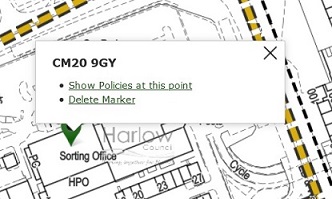
By search location
- After searching for a map location, click on the search location marker and choose the "Show policies at this point" link.
^ Return to Contents
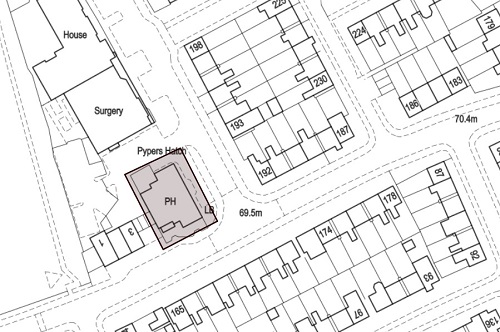
Annotating the Map
The site has functionality to allow the user to annotate the mapping subsequent to printing, exporting or sharing a map.
Adding Annotations
- To draw a polygon shape, click on the Draw Polygon tool

Mark out the polygon shape over the map by clicking once to add points
that make up the shape and double click to complete the shape. Note, you can press the Esc button on the keyboard to cancel the drawing.
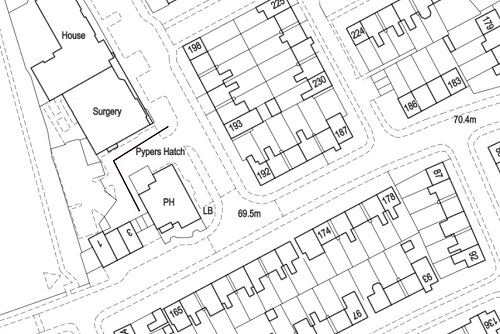
- To draw a line, click on the Draw Line tool

Mark out the line over the map by clicking once to add points that
make up the line and double click to complete the line. Note, you can press the Esc button on the keyboard to cancel the drawing.
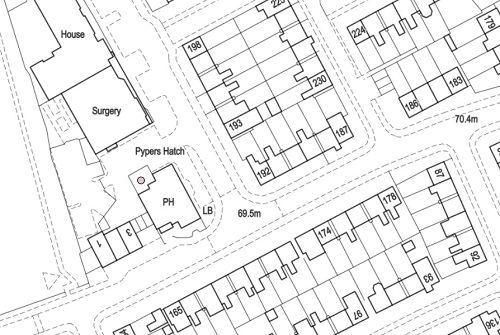
- To draw a point, click on the Draw Point tool

Mark out the point over the map by clicking once to add the point.
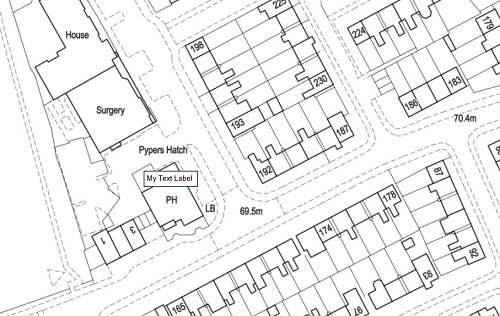
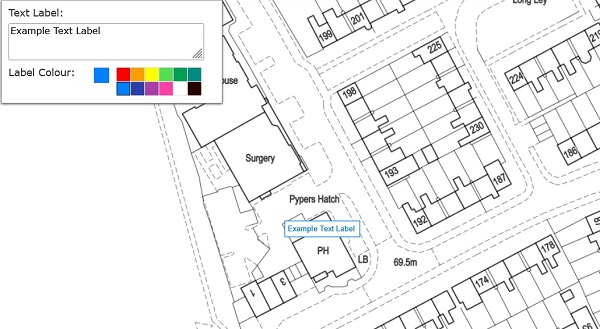
- To add a label, click on the Add Label tool

The following dialog will appear top left of the map in order to define the label text and colour.

Next, click once over the map to add the label.
Editing and Deleting Annotations
Use the Edit Shape/Label tool  and select the relevant feature on the map.
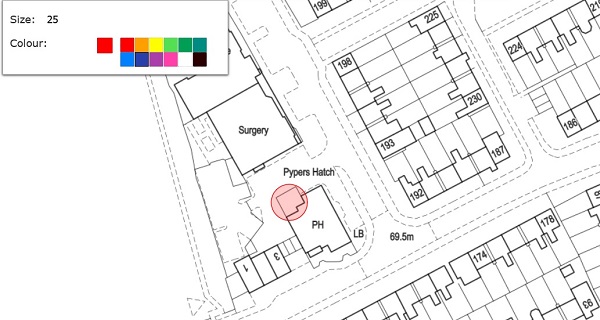
The feature's attributes will display in the dialog box top left. Here the colour, style and text label can be updated, as shown in the examples below -
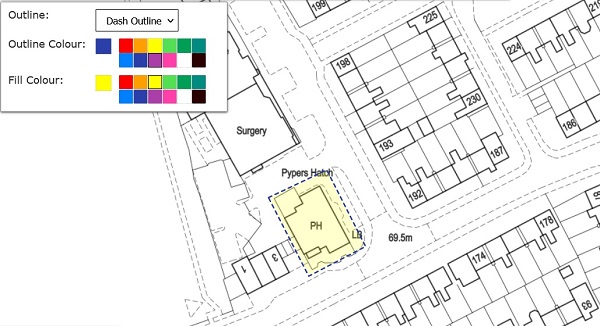
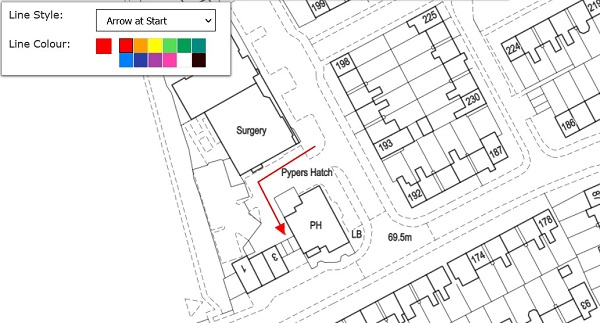
- To change the shape of the feature, move the mouse over the edge of the feature. Click on the blue circle and drag to a new position.
- To move the feature hold down the mouse on the feature and drag to the a new position.
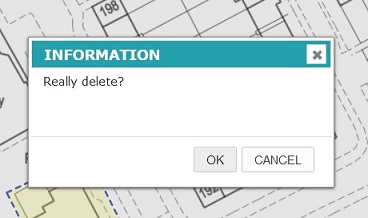
- To delete a feature press the delete Delete tool
 . Alternatively, press the "Delete" button on the keyboard.
Confirm the deletion on the following dialog.
Map Printing
The site provides functionality for the user to print the map along
with a map legend and custom user information.
To print the map -
- Select the print button on the toolbar
This will open the print layout page in a new window, as shown below.
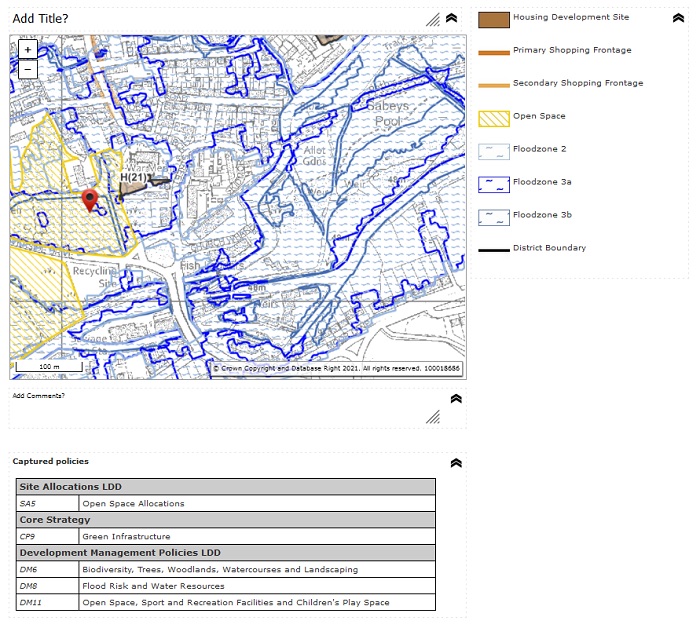
This layout includes-
- Current map view
- Input for the user to add a custom title
- Input for the user to add custom comments
- Map legend containing all policy layers visible on the map
- List of captured policies if appropriate.
- Annotations drawn over the mapping by the user.
- To add a custom title, replace "Add Title?" with the required
text.

If a title is not required this element can be hidden by clicking
the hide button in the top right.
- To add a custom comments, replace "Add Comments?" with
the required text.

If no comments are necessary this element can be hidden by clicking
the hide button in the top right.
- If the map legend is not required on the print it may be hidden
by clicking the hide button in the top right
- If policies have been captured by a query these will display below the mapping.
This element can be hidden by clicking the hide button in the top right.
- When the layout is finalized the page can be printed in the normal
manner. The layout is set to print out at A4 Landscape
^ Return to Contents
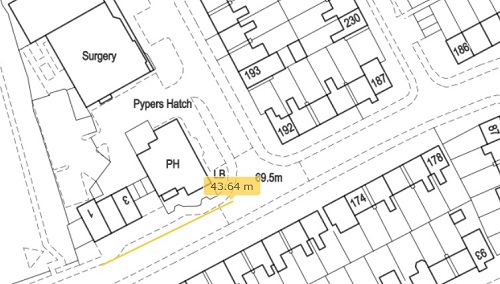
Measuring Distances and Areas on the Map
- To measure a distance, click on the Measure Distances tool

Mark out the line over the map by clicking once to add a vertex and
double clicking to complete the line. (Shown as dashed black line).
The distance is shown as the line is marked out, as shown below.
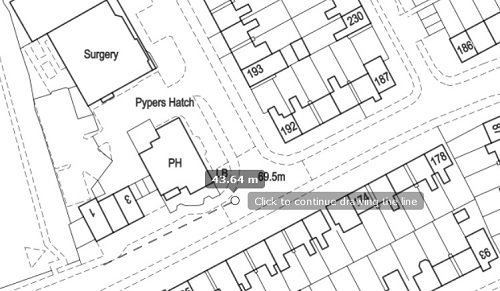
The distance will display as shown below.
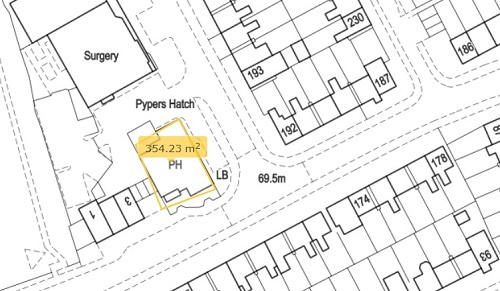
- To measure an area, click on the Measure Areas tool

Mark out the polygon shape over the map by clicking once to add a
vertex and double clicking to complete the shape. (Shown as dashed black line).
The area is shown as the shape is marked out, as shown below.
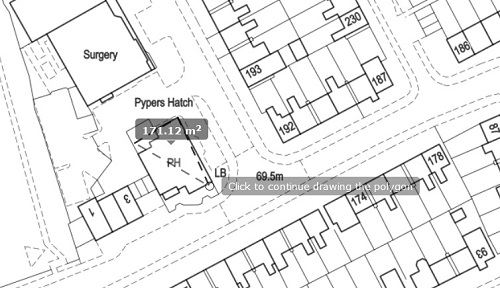
The area will display as shown below .
^ Return to Contents
Exporting the Map
To save the map in PNG format, click the Exporting Map  button.
The user will be prompted to either open the file or save it. Choose
Save and define the folder location to download to the local machine.
Sharing the Map
Any map view can be shared. To do so. click on the Share map tool

The following dialog will appear to enable the user to share the current view and visible policy layers via Facebook, Twitter and LinkedIn.
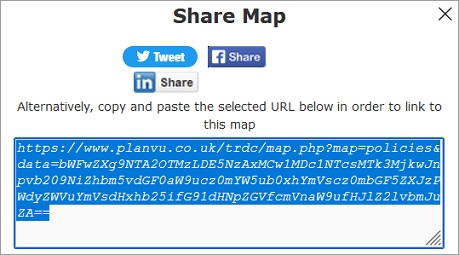
Alternatively, the selected URL can be copied in order to directly share the map.
^ Return to Contents